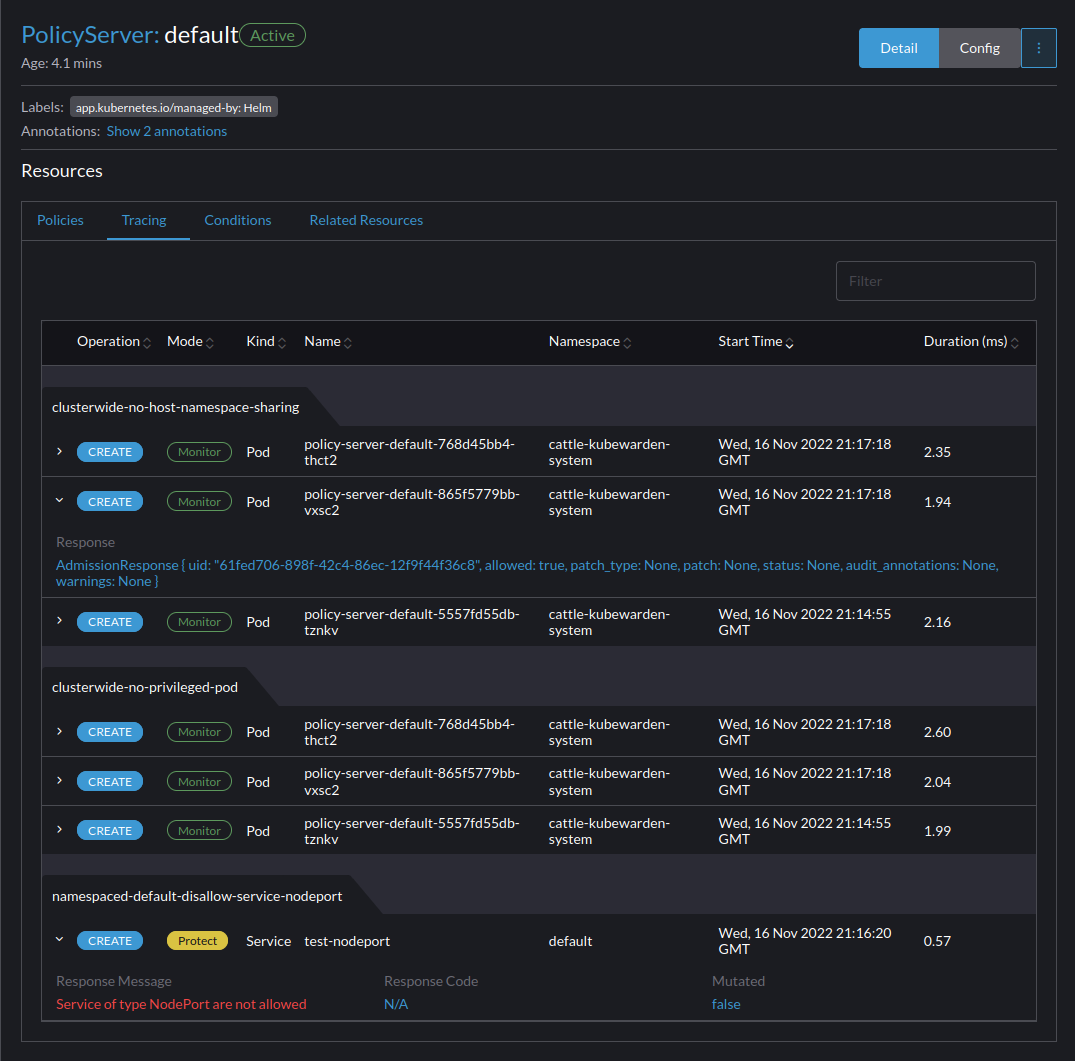
Tracing
Tracing allows to collect fine grained details about policy evaluations. It can be a useful tool for debugging issues inside of your Kubewarden deployment and policies.
We will use Jaeger to receive, store and visualize trace events.
Policy tracing logs
Prerequisites
Cert-Manager and OpenTelemetry are required. Follow these instructions to install Cert Manager and the OpenTelemetry Operator.
Install Jaeger
Apply the installation steps from the tracing quickstart.
Once all the resources have been created by the Jaeger operator, we will have a
Service under my-open-telemetry-collector.jaeger.svc.cluster.local.
The Jaeger Query UI will be reachable at the following address:
https://<CLUSTER_IP>/api/v1/namespaces/jaeger/services/http:my-open-telemetry-query:16686/proxy/search
This endpoint may be unique depending on your configuration. You can find the endpoint listed for your Jaeger resource under the Services page.
Update rancher-kubewarden-controller with Jaeger endpoint
You will need to edit the rancher-kubewarden-controller resource to add the Jaeger endpoint "my-open-telemetry-collector.jaeger.svc.cluster.local:4317".
For instance:
telemetry:
  tracing:
    enabled: True
    jaeger:
      endpoint: "my-open-telemetry-collector.jaeger.svc.cluster.local:4317"
      tls:
        insecure: true
my-open-telemetry-collector is the service we installed under the jaeger namespace.
To keep things simple, we are not going to encrypt the communication between the OpenTelemetry collector and the Jaeger endpoint.
This is not meant to be a production deployment. We strongly recommend to read Jaeger's official documentation.
You should now be able to view any failed requests for policies tied to a specific Policy Server or the detail view for any given policy. You can get a more in-depth view into the traces from the Jaeger UI.